

🍮
文章封面来自殘夜 ZANYA-✨
鸽了一段时间没有水文章了 🤕
主要最近发生的事情有点多忙换工作忙生活balala 😅
当然还有忙着打电动hahaha 🤣
捏住九月的尾巴 一定要憋一篇文章出来~
最近去做运维了 做了些监控的工作 刚好拿来水一下
写的不好 但希望对你有帮助 🤭
本文主要介绍 SpringBoot Actuator Promethus
HTTP形式的 相关自定义指标和自定义埋点
阅读前确保你有一些Java和Promethus基础 不然有些地方可能会不太理解
相关文档:
前提
POM 引入相关依赖
<!-- actuator -->
<dependency>
    <groupId>org.springframework.boot</groupId>
    <artifactId>spring-boot-starter-actuator</artifactId>
</dependency>
<!-- auto enable promethus endpoint -->
<dependency>
    <groupId>io.micrometer</groupId>
    <artifactId>micrometer-registry-prometheus</artifactId>
</dependency>
导入micrometer-registry-prometheus依赖会自动生成 promethus endpoint
# 没有类似配置 修改actuator相关端口和路径 servlet相关路径
# 访问 http://ip:port/actuator 查看所有endpoint

# 如果设置了
server.servlet.context-path = /myapp
# 访问 http://ip:port/myapp/actuator 查看所有endpoint

# 如果设置了
management.server.port = 8080
management.endpoints.web.base-path=/manage
# 访问 http://ip:8080/manage 查看所有endpoint

# 如果对endport进行了相关限制请确保prometheus端点保持暴露
management.endpoints.web.exposure.include=${MANAGEMENT_ENDPOINTS_WEB_EXPOSURE_INCLUDE:prometheus}
endpoint 形如:
{
	_links: {
		...
		prometheus: {
			href: "http://localhost:9081/actuator/prometheus",
			templated: false
		},
		...
	}
}
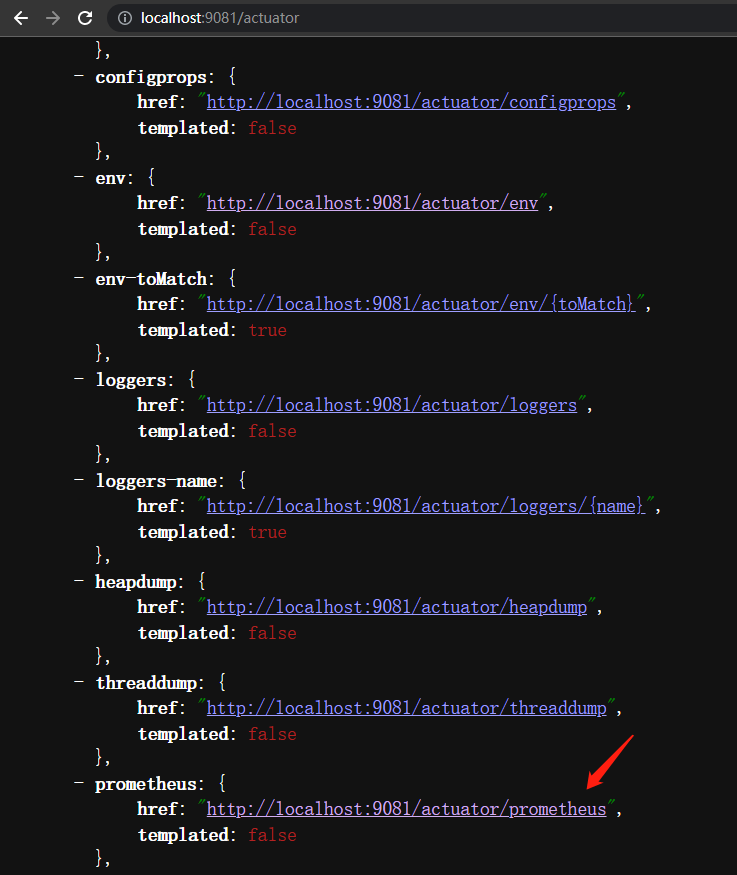
访问 promethus endpoint 查看 promethus 格式指标
指标形如:
# HELP jvm_gc_max_data_size_bytes Max size of old generation memory pool
# TYPE jvm_gc_max_data_size_bytes gauge
jvm_gc_max_data_size_bytes 5.668077568E9
# HELP jvm_buffer_count_buffers An estimate of the number of buffers in the pool
# TYPE jvm_buffer_count_buffers gauge
jvm_buffer_count_buffers{id="direct",} 2.0
jvm_buffer_count_buffers{id="mapped",} 0.0
# HELP logback_events_total Number of error level events that made it to the logs
# TYPE logback_events_total counter
logback_events_total{level="warn",} 0.0
logback_events_total{level="debug",} 0.0
logback_events_total{level="error",} 0.0
logback_events_total{level="trace",} 0.0
logback_events_total{level="info",} 7.0

promethus 格式指标可以简单理解为:
指标名称{指标维度1,指标维度2} 指标值
例如上图中指标
logback_events_total{level=“info”,} 7.0
logback_events_total{level=“warn”,} 0.0
logback_events_total{level=“debug”,} 0.0
logback_events_total{level=“error”,} 0.0
即代表 指标名称 logback_events_total 在 info 维度下 指标值是 7.0 其余维度是 0.0
能够正常访问上述相关地址 即依赖引用成功且可使用
自定义 Actuator Endpoint
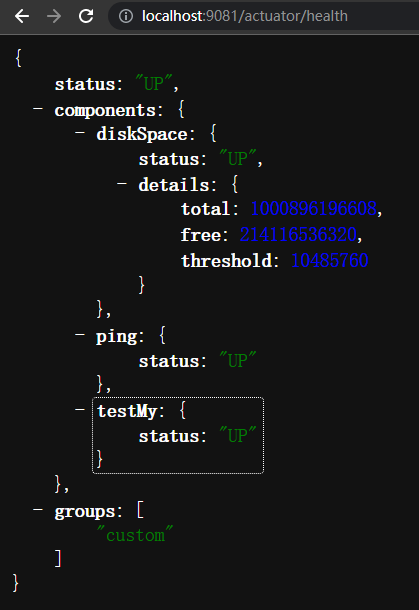
自定义 Health Endpoint
对应Demo TestMyHealthIndicator
关键代码如下
/**
 * 实现 HealthIndicator 重新health方法 增加自定义的检查健康的方法即可
 * 生成健康检查名为 HealthIndicator前的字符串 例如TestMyHealthIndicator 生成健康检查名称为 testMy
 */
@Component
class TestMyHealthIndicator implements HealthIndicator {

    @Override
    public Health health() {
        int errorCode = check();
        if (errorCode != 0) {
            return Health.down().withDetail("Error Code", errorCode).build();
        }
        return Health.up().build();
    }

    private int check() {
        // perform some specific health check
        return 0;
    }

}
自定义 Info Endpoint
对应Demo TestMyInfoContributor
关键代码如下
/**
 * 实现 InfoContributor 重写contribute方法
 * 生成自定义info指标 指定自定义指标集合的名称和包含指标的map集合即可
 */
@Component
public class TestMyInfoContributor implements InfoContributor {

    @Override
    public void contribute(Info.Builder builder) {
        builder.withDetail("example", Collections.singletonMap("key", "value"));
    }

}
自定义 Actuator Endpoint
对应Demo TestCustomEndpoints CustomData
关键代码如下
实体类 CustomData
@Data
@AllArgsConstructor
public class CustomData {
    String testString;
    Integer testInteger;
}
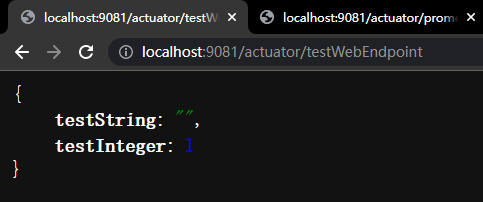
定义Endpoint
/**
* @WebEndpoint 注解指定 Endpoint名称
* @ReadOperation 提供读接口
* @WriteOperation 提供写接口
*/
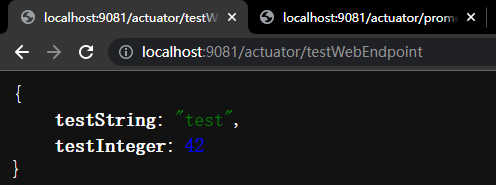
@WebEndpoint(id= "testWebEndpoint")
@Component
public class TestCustomEndpoints {
// init
private CustomData customData = new CustomData("", 1);
/**
* get customData value
* http://localhost:9081/actuator/testWebEndpoint
*
* @return
*/
@ReadOperation
public CustomData getData() {
return customData;
}
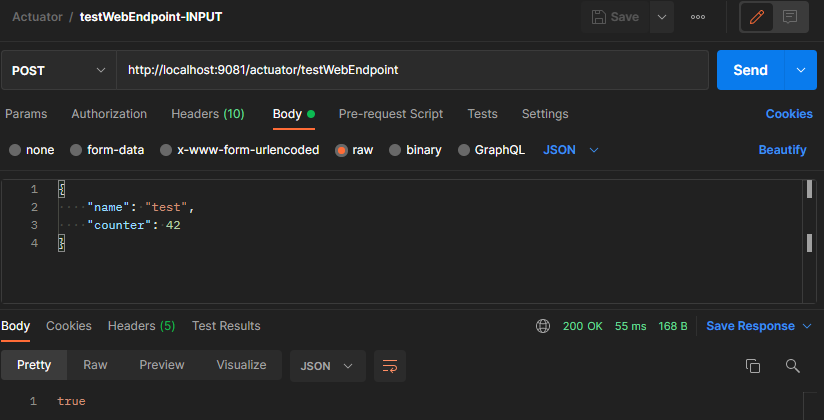
/**
* post to change customData
* http://localhost:9081/actuator/testWebEndpoint
* request body
* {
* "name": "test",
* "counter": 42
* }
*
* @param name
* @param counter
*/
@WriteOperation
public Boolean updateData(String name, int counter) {
// injects "test" and 42
customData.setTestString(name);
customData.setTestInteger(counter);
return Boolean.TRUE;
}
}
生成的自定义Endpint如下

可以通过 POST 方法修改自定义Endpoint指标内容相关值
自定义 Actuator Promethus 埋点
正常情况下 直接定义一些 Endpint 通过JSON的方式暴露出来个人觉得其实没太大的用处
应该还是需要通过把这些指标转化成能通过其他监控软件进行图形化的展示
所以 Promethus 指标格式的Endpoint就至关重要
原生的Promethus Endpoint为我们生成了下面三种反应所有HTTP请求的情况
# 通过uri的tag区分不同的接口
# 请求数
http_server_requests_seconds_count{exception="None",method="GET",outcome="SUCCESS",status="200",uri="/actuator/",} 1.0
# 请求时间合计
http_server_requests_seconds_sum{exception="None",method="GET",outcome="SUCCESS",status="200",uri="/actuator/",} 0.013806
# 每秒请求峰值
http_server_requests_seconds_max{exception="None",method="GET",outcome="SUCCESS",status="200",uri="/actuator/",} 0.013806
原生的上述指标其实泛用性不高 当我们
-
只想监控特定的接口
-
想获取接口的P90 P85值
-
不想让指标存储在内存中重启后指标不会重置
-
希望统计实际业务场景的相关指标
等等等 原生的指标都是满足不了的
所以我们就需要做一些 自定义 Actuator Promethus 埋点
注解 @Timed(推荐)
关于HTTP请求的自定义埋点,比较简单可以直接在请求Controller层使用Micrometer的@Timed注解实现
增加@Timed注解自动生成对应的Prometheus指标
使用方式如下(可以在类或方法中使用)
需要根据情况选择合适的注解位置
注解相关参数较少
源码如下
@Target({ElementType.ANNOTATION_TYPE, ElementType.TYPE, ElementType.METHOD})
@Repeatable(TimedSet.class)
@Retention(RetentionPolicy.RUNTIME)
@Inherited
public @interface Timed {
    String value() default "";
    String[] extraTags() default {};
    boolean longTask() default false;
    double[] percentiles() default {};
    boolean histogram() default false;
    String description() default "";
 }
-
value
表示prometheus指标名称
-
extraTags
表示prometheus指标维度
-
longTask
longTask类型的指标
-
percentiles
表示指标分位数
-
histogram
表示所是否生成直方图指标
-
description
表示prometheus指标注释
通过几个例子很好理解相关参数作用
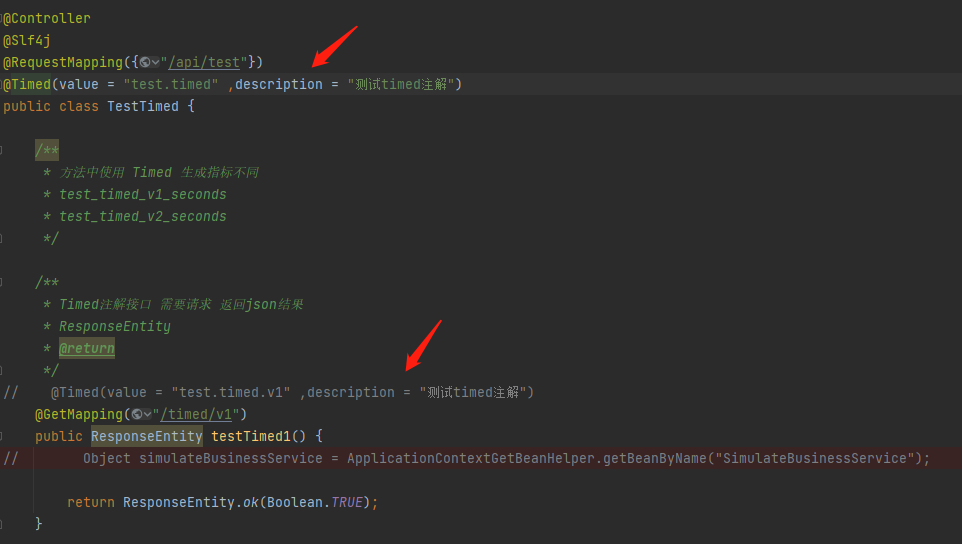
Controller类使用Timed
(对应 Demo TestTimed)
@Timed(value = “test.timed” ,description = “测试timed注解”)
使用注解自动生成的指标如下

## 指标备注 对应 注解中的 description
# HELP test_timed_seconds 测试timed注解

## 指标类型(prometheus summary类型) 自动生成
# TYPE test_timed_seconds summary

## HTTP 请求次数
## 指标前缀 test_timed 对应 注解中的 value
test_timed_seconds_count{exception="None",method="GET",outcome="SUCCESS",status="200",uri="/api/test/timed/v1",} 1.0

## 对应请求的 HTTP 调用总时间
test_timed_seconds_sum{exception="None",method="GET",outcome="SUCCESS",status="200",uri="/api/test/timed/v1",} 0.0280736

## 同一个Controller下生成的指标名称相同维度不同
## 例如 uri 维度
test_timed_seconds_count{exception="None",method="GET",outcome="SUCCESS",status="200",uri="/api/test/timed/v2",} 1.0

## 对应请求的 HTTP 调用总时间
test_timed_seconds_sum{exception="None",method="GET",outcome="SUCCESS",status="200",uri="/api/test/timed/v2",} 0.0068114

## 指标备注 对应 注解中的 description
# HELP test_timed_seconds_max 测试timed注解

## 指标类型(prometheus gauge类型) 自动生成
# TYPE test_timed_seconds_max gauge

## 对应请求的 每秒请求峰值
test_timed_seconds_max{exception="None",method="GET",outcome="SUCCESS",status="200",uri="/api/test/timed/v1",} 0.0280736

## 对应请求的 每秒请求峰值
test_timed_seconds_max{exception="None",method="GET",outcome="SUCCESS",status="200",uri="/api/test/timed/v2",} 0.0068114
这种指标适用于统计 标记的请求 接口压力 请求数 请求处理效率等
Controller类中方法使用Timed
只生成对应方法请求的指标
Timed LongTask 参数
对应 Demo TestLongTimed
@Timed(value = “test.long.timed” ,description = “测试long_timed注解”, longTask = true)
longTask参数控制生成 Micrometer LongTaskTimer 类型 指标

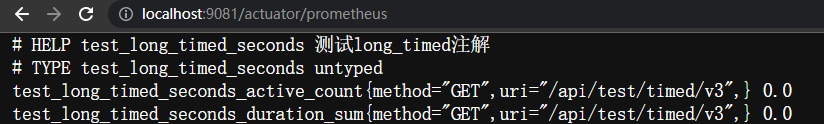

# HELP test_long_timed_seconds 测试long_timed注解
# TYPE test_long_timed_seconds untyped

## 生成两个指标
## 当前存活的(未处理完的) 请求数
## test_long_timed_seconds_active_count
## 当前所有存活请求的总持续时间
## test_long_timed_seconds_duration_sum
## longTask生成的指标 维度只有两个
## 能够实时反应标记接口的 请求运行总时间 总个数
## 当没有请求访问标记接口时 longTask指标都为 0
## 通常做请求平均时间 触发阈值告警
test_long_timed_seconds_active_count{method="GET",uri="/api/test/timed/v3",} 0.0
test_long_timed_seconds_duration_sum{method="GET",uri="/api/test/timed/v3",} 0.0
老版本的Actuator longTaskTimer 使用有问题,具体从哪个版本修复的没仔细查(
测试SpringBoot版本:v2.7.3 没有问题
测试SpringBoot版本:2.2.2.RELEASE
异常:
"Prometheus requires that all meters with the same name have the same set of tag keys. There is already an existing meter named 'test_long_timed_seconds' containing tag keys [method, uri]. The meter you are attempting to register has keys [exception, method, outcome, status, uri]."
修复方案(没有经过仔细验证,修复方法仅供参考):
源码覆盖的方式修复
org.springframework.boot.actuate.metrics.web.servlet.WebMvcMetricsFilter的record方法
修改如下
    /**
     * fix record func by lk
     * @param timingContext
     * @param request
     * @param response
     * @param exception
     */
    private void record(TimingContext timingContext, HttpServletRequest request, HttpServletResponse response,
                        Throwable exception) {
        Object handler = getHandler(request);
        Set<Timed> annotations = getTimedAnnotations(handler);
        Timer.Sample timerSample = timingContext.getTimerSample();
        if (annotations.isEmpty()) {
            Builder builder = this.autoTimer.builder(this.metricName);
            timerSample.stop(getTimer(builder, handler, request, response, exception));
            return;
        }
        for (Timed annotation : annotations) {
            Builder builder = Timer.builder(annotation, this.metricName);

            // Only Long Task Timed Not register
            // Avoid java.lang.IllegalArgumentException:
            // Prometheus requires that all meters with the same name have the same set of tag keys.
            // There is already an existing meter containing tag keys [method, status, uri]. The meter you are attempting to register has keys [exception, method, status, uri].
            if(!annotation.longTask()){
                timerSample.stop(getTimer(builder, handler, request, response, exception));
            }
            // Original Code
//            timerSample.stop(getTimer(builder, handler, request, response, exception));
        }
    }
Timed 注解计算百分位数
对应 Demo TestTimedPercentile
@Timed(value = “test.timed” ,description = “测试timed注解”,percentiles = {0.9},histogram = true)
percentiles 参数控制 生成客户端(JAVA APP)分位数指标

# TYPE test_timed_seconds histogram

## 客户端自动计算 百分位数值发送到监视系统
## 例中 自动计算了 P90 值
## 即计算了 一段时间中 百分之90的样本值 不超过 XXX(P90值)
## 需要产生多个百分位数 逗号分隔配置即可
## percentiles = {0.5, 0.9, 0.95,0.99}
test_timed_seconds{exception="None",method="GET",outcome="SUCCESS",status="200",uri="/api/test/timed/v4",quantile="0.9",} 0.00524288
histogram 参数控制 生成服务端(Prometheus)分位数指标
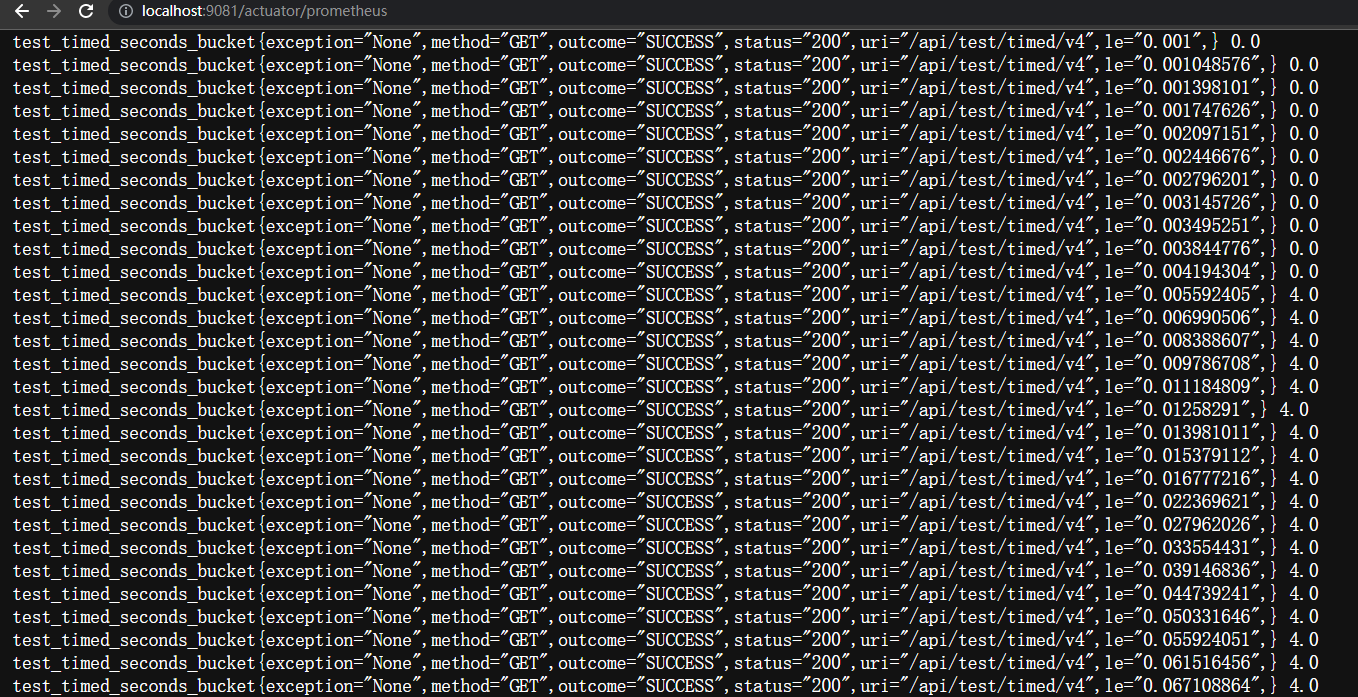
## 启用直方图参数后 会默认生成 不同区间样本数的指标
## 下面的指标 表示
## 请求时间 小于等于0.003844776 请求的个数
test_timed_seconds_bucket{exception="None",method="GET",outcome="SUCCESS",status="200",uri="/api/test/timed/v4",le="0.003844776",} 0.0
## 请求时间在区间 小于等于0.004194304 请求的个数
test_timed_seconds_bucket{exception="None",method="GET",outcome="SUCCESS",status="200",uri="/api/test/timed/v4",le="0.004194304",} 0.0
## 请求时间在区间 小于等于0.005592405 请求的个数
test_timed_seconds_bucket{exception="None",method="GET",outcome="SUCCESS",status="200",uri="/api/test/timed/v4",le="0.005592405",} 4.0

## 暴露不同区间的样本值之后 通过Prometheus函数公式计算P90值
## histogram_quantile(0.9, rate(test_timed_seconds_bucket[10m]))
自定义Counter埋点
当@Timed注解满足不了埋点需求时就需要通过代码实现自定义埋点
Counter是一种从0开始 只增不减的指标类型
使用 PrometheusMeterRegistry 创建出 counter指标 在调用相关增值方法即可
对应 Demo MyCounter
关键代码如下
/**
 * 第一种方式注册自定义指标
 * inject MeterRegistry
 */
@Component
public class MyCounter {

    Counter counter;

    /**
     * 注册Counter指标
     * @param registry
     */
    public MyCounter(MeterRegistry registry) {
        // Counter 指标名称 和 Tags
        counter = registry.counter("my.counter", Tags.empty());
    }

    /**
     * 提供增长Counter指标的方法 供业务代码调用
     * 调用实例见
     * SimulateBusinessController SimulateBusinessService
     */
    public void increment(){
        // 默认增加1
//        counter.increment();
        // 可设置增加值
        counter.increment(1);
    }

}
最终Demo代码生成的指标如下

自定义Gauge埋点
Gauge是可增减设置初始值的指标类型 可以准确记录具体值
Demo中提供了两种方法创建Gauge埋点
推荐使用 Demo中 MyMeterBinderConfiguration的方法
将Gauge指标持久化到Redis中 提供从Redis中获取指标值的方法并注册指标即可 这样可以做到升级上线停机重启Java应用时 需要记录的指标不丢失(例如记录支付次数、登录次数、扫码次数等等)
关键代码如下
    /**
     * 默认情况下,所有MeterBinder bean中的指标都会自动绑定到Spring管理的MeterRegistry
     *
     * @param simulateBusinessService
     * @return
     */
    @Bean
    public MeterBinder payGaugeCount(SimulateBusinessService simulateBusinessService) {
        // 绑定获取指标函数 并指定Tags
        return (registry) -> Gauge.builder("core.pay.gauge",simulateBusinessService::getCountFromRedis).tags("sys","core","app",application).register(registry);
    }
最终Demo代码生成的指标如下
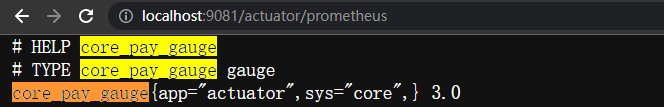
一些问题
Path传参 原生Actuator不能记录Mapping后的uri
问题描述 见DEMO TestAbstractUriTimed
通过path传参的接口 实际Actuator记录的指标是不会包含参数值的
    @GetMapping("/timed/{path}")
    public ResponseEntity testAbstractTimed(@PathVariable String path) {
        System.out.println(path);
        return ResponseEntity.ok(Boolean.TRUE);
    }
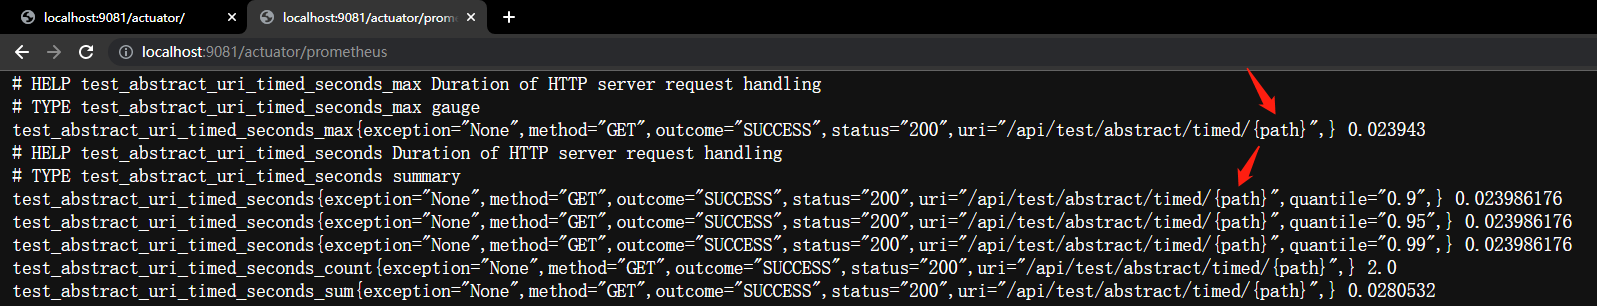
实际生成的指标
# uri="/api/test/abstract/timed/{path}"
test_abstract_uri_timed_seconds_count{exception="None",method="GET",outcome="SUCCESS",status="200",uri="/api/test/abstract/timed/{path}",} 2.0
其实我能理解官方记录Mapping前uri的理由
就比如参数是个id 调用接口通过id 获取一些数据库数据 这些id当然是不同的
而且数据多了 如果记录Mapping后的uri会根据id生成不同的指标
这样其实是有问题的
但一些老的架构 喜欢把很多接口抽象成一个Controller通过Path参数再调用不同的方法…
我需要改造的项目就遇到了这种设计 很坑
如果你想要将Mapping后的uri记录到指标中就需要调整Actuator框架代码…
同包同路径同名源码覆盖的方式重写 WebMvcTags
覆盖的关键方法如下
package org.springframework.boot.actuate.metrics.web.servlet;

....

	private static String getMatchingPattern(HttpServletRequest request) {
		PathPattern dataRestPathPattern = (PathPattern) request.getAttribute(DATA_REST_PATH_PATTERN_ATTRIBUTE);
		if (dataRestPathPattern != null) {
			return dataRestPathPattern.getPatternString();
		}

		/**
		 * modified by lk 2022 9 28
		 * do not record tag with PATH BEFORE MAPPING
		 */
//		return (String) request.getAttribute(HandlerMapping.BEST_MATCHING_PATTERN_ATTRIBUTE);
		return (String)request.getAttribute(HandlerMapping.PATH_WITHIN_HANDLER_MAPPING_ATTRIBUTE);
	}

...
简单测试测试图表~
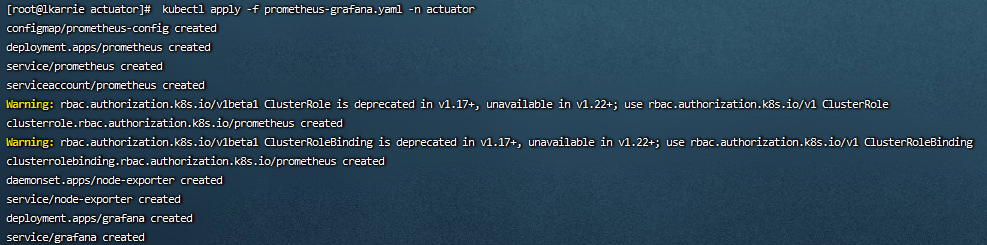
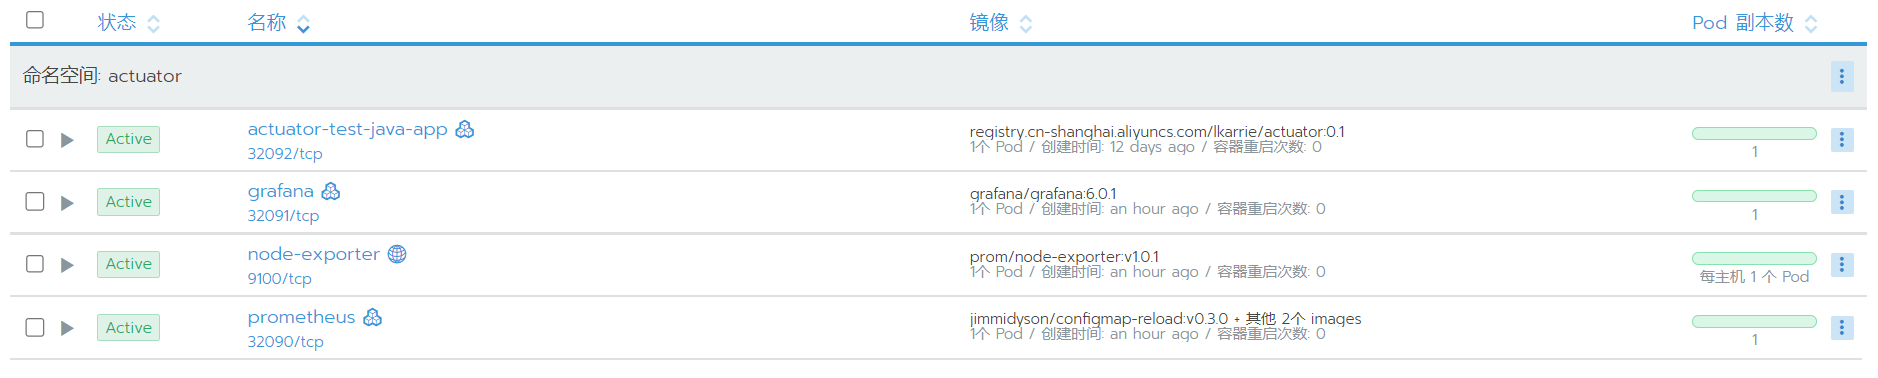
快速部署一套普米和Grafana把Demo代码打个镜像手动部一下
Yaml在demo项目里

编辑一下普米配置拉取java应用指标(编辑后自动刷新配置)
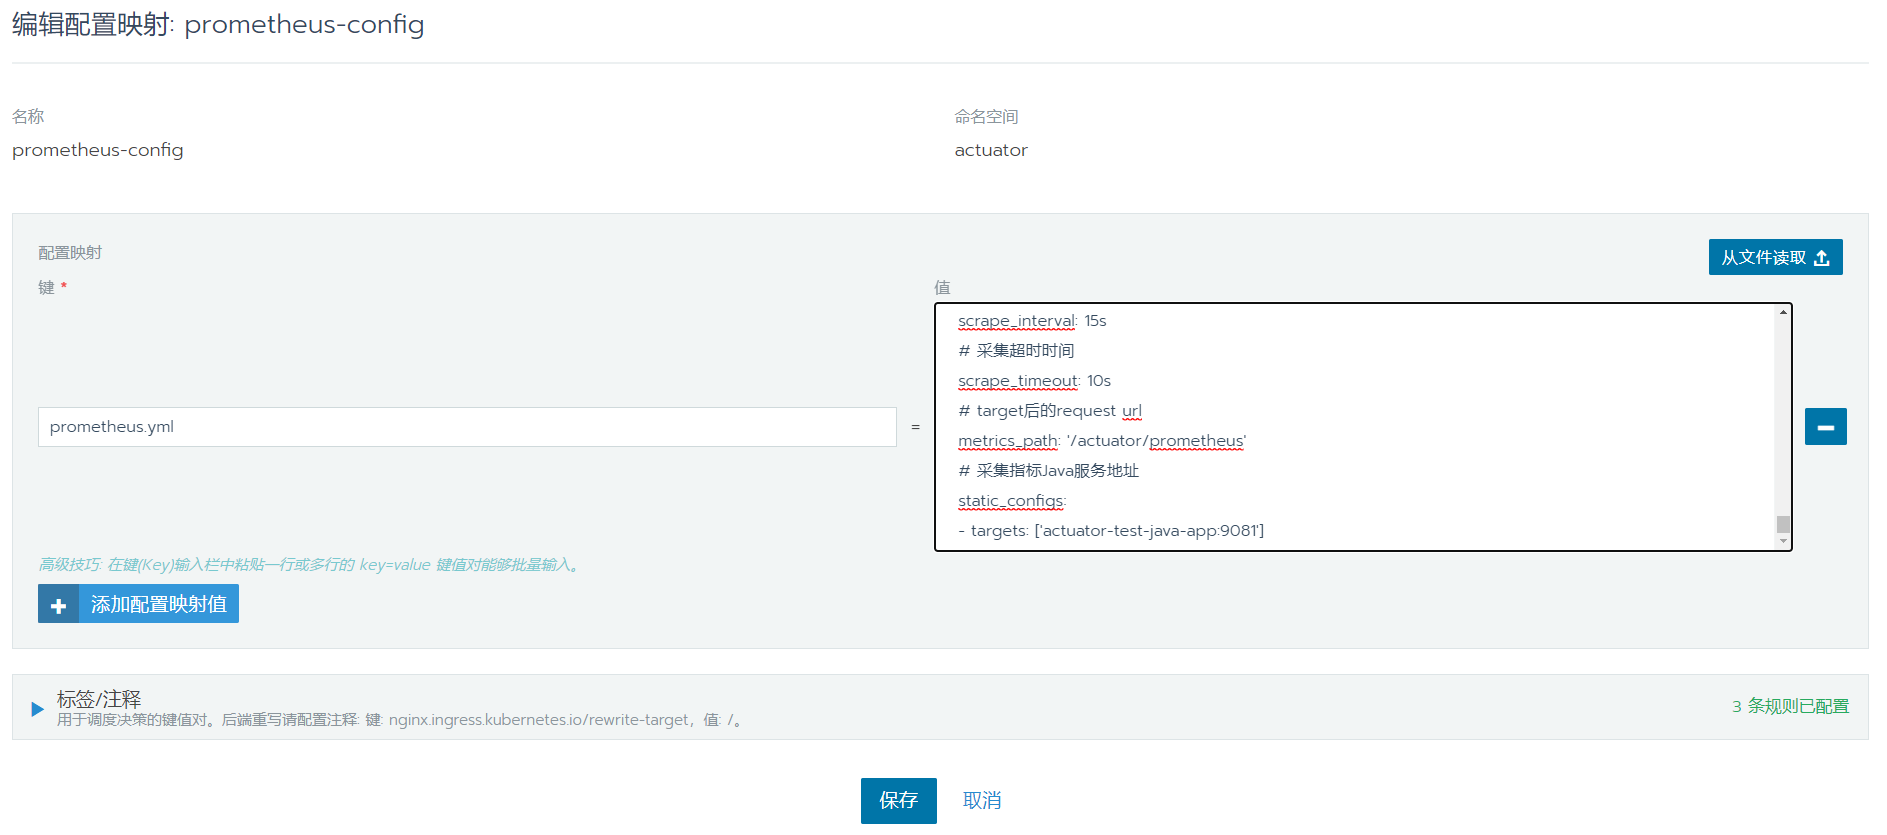
- job_name: 'java-app'
  # 采集间隔
  scrape_interval: 15s
  # 采集超时时间
  scrape_timeout: 10s
  # target后的request url
  metrics_path: '/actuator/prometheus'
  # 采集指标Java服务地址
  static_configs:
  - targets: ['actuator-test-java-app:9081']
调一下下接口

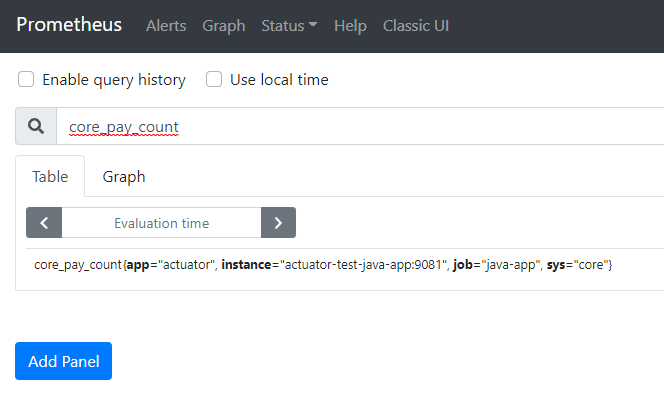
查一查普米
画个图表看看:D
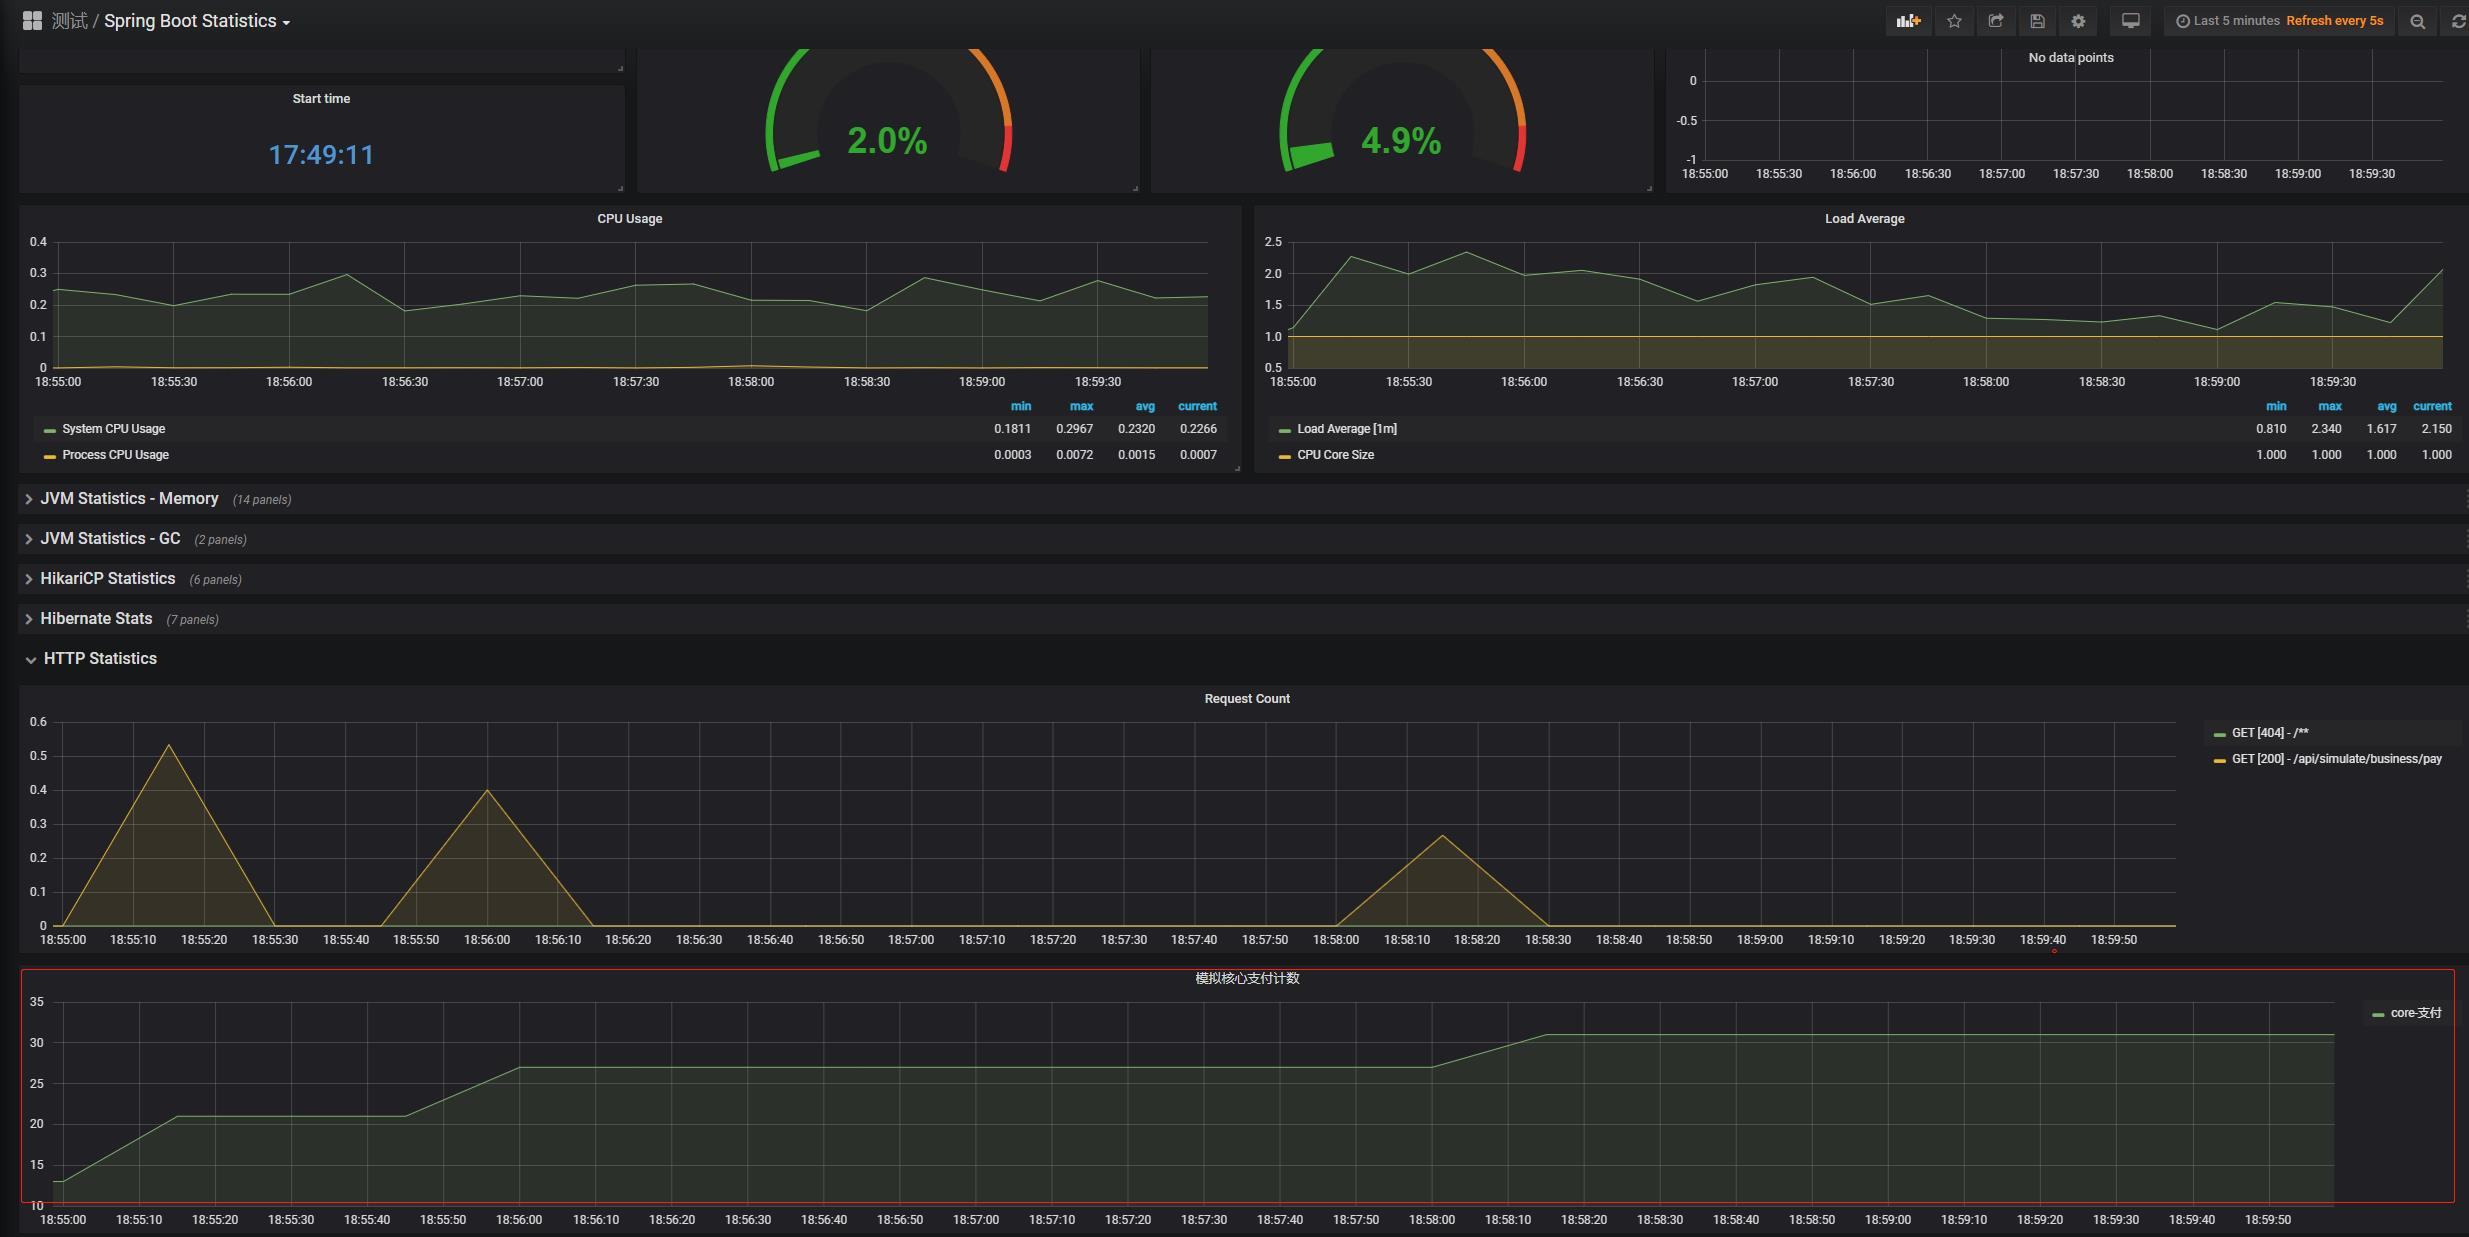
大概就这么多~